Wasserman Real Estate Group Blog

Welcome to the Wasserman Real Estate Group blog, your local source for real estate insight, market data, and community updates throughout La Quinta and the greater Coachella Valley. Based in the desert and brokered by Equity Union Luxury Properties, Wasserman Real Estate Group helps buyers and sellers make informed decisions using local experience, current housing data, and a practical understanding of how each neighborhood performs.

La Quinta remains one of the Coachella Valley’s most desirable real estate markets, known for its golf communities, luxury homes, mountain views, resort lifestyle, and proximity to Indian Wells, Palm Desert, PGA West, Old Town La Quinta, and the Santa Rosa Mountains. The city has grown from 5,260 full-time residents at incorporation in 1982 to approximately 37,846 full-time residents today, with more than 12,000 additional seasonal residents enjoying the winter and spring months.

Our blog is designed to help homeowners, buyers, investors, and seasonal residents better understand the market. Here, you will find updates on La Quinta home values, Coachella Valley inventory trends, luxury golf community reports, buyer and seller strategies, neighborhood spotlights, and practical guidance for navigating today’s real estate conditions.

Recent market data shows La Quinta remains a high-value desert market. In March 2026, Redfin reported a La Quinta median sale price of approximately $842,000, with homes selling in an average of 79 days and 145 closed sales during the month. These numbers reinforce why local pricing strategy, neighborhood-level analysis, and accurate market interpretation are essential for both buyers and sellers.

Wasserman Real Estate Group brings deep Coachella Valley roots to every client relationship. Mark and Pam Wasserman have lived in the Coachella Valley for more than 50 years, and the team serves buyers and sellers throughout La Quinta, Palm Desert, Indian Wells, Palm Springs, Indio, Rancho Mirage, and surrounding desert communities. Wasserman Real Estate Group was also named among Palm Springs Life’s Top Realtors of 2026, a recognition based on residential sales achievements verified through MLS data and public records.

Whether you are preparing to sell, searching for a second home, evaluating a golf course property, or simply watching the market, this blog provides clear, data-driven insight to help you move forward with confidence.

Sept. 23, 2021

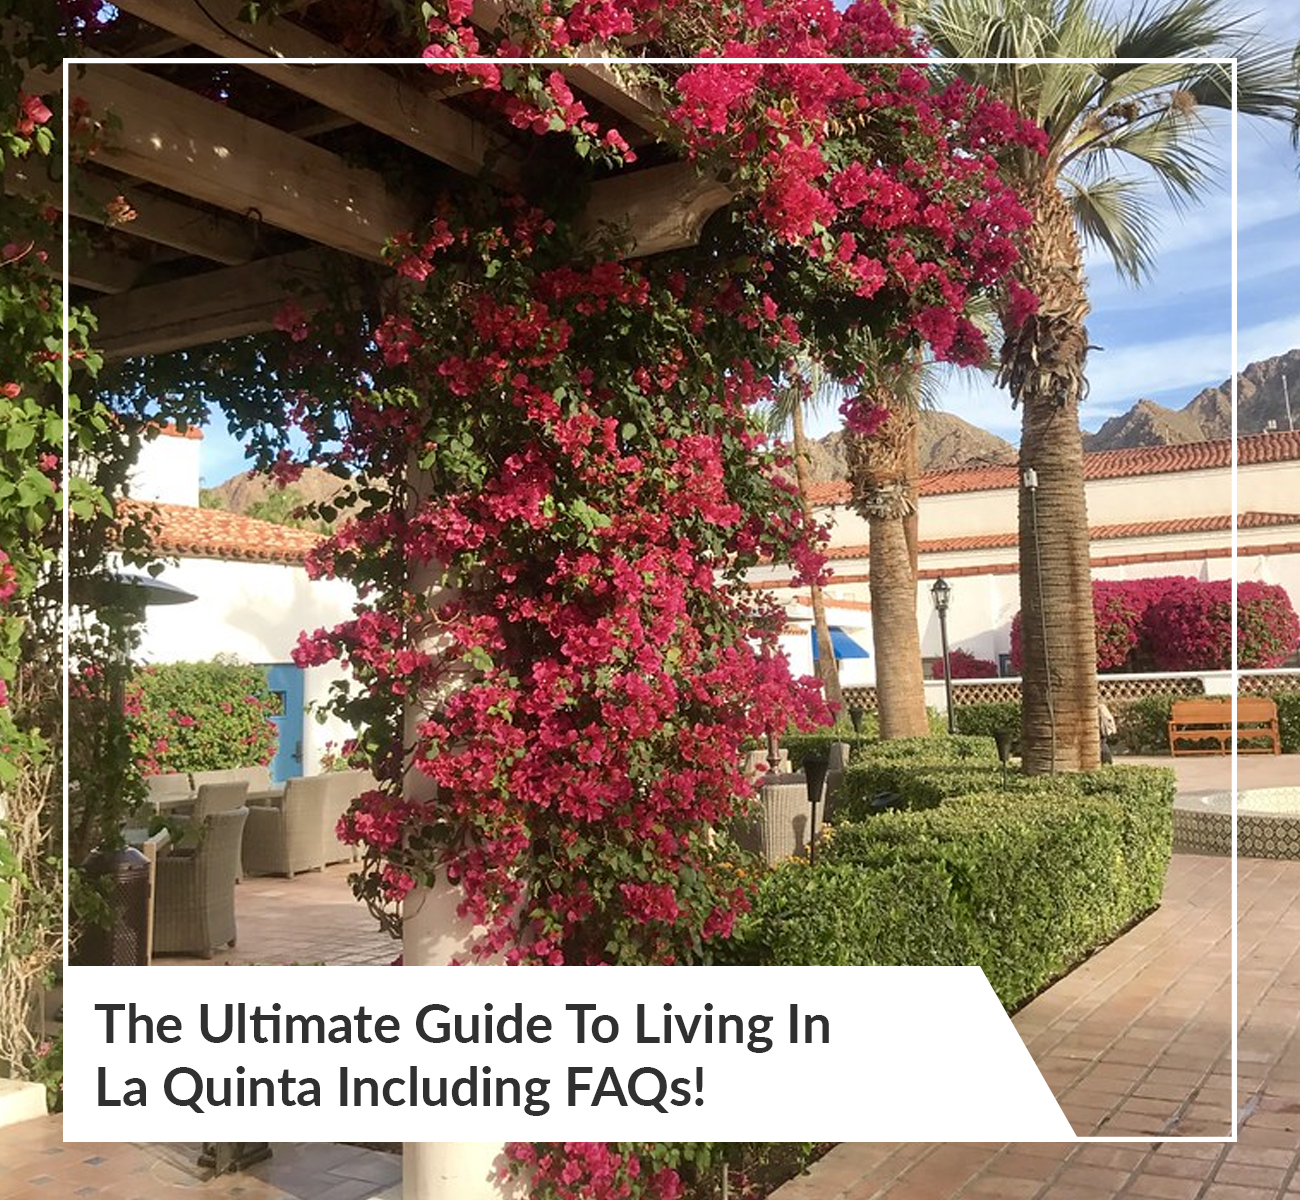
The Ultimate Guide To Living In La Quinta Including FAQs!

Living in La Quinta, CA

Living In La Quinta


With some breathtaking views of the Santa Rosa Mountains, La Quinta, California, is one of the fastest-growing cities in Palm Springs. It’s becoming increasingly popular for a number of reasons, including the natural beauty, amenities, golf, and peaceful atmosphere. As one of the most popular golf destinations across the USA, you’ve likely heard of it, but do you know what makes La Quinta so special? Here’s the Ultimate Guide to Living in La Quinta

View More
Posted in Buying A Home
Sept. 13, 2021

August - Housing Inventory Rose & Prices Dropped Slightly

The August 2021 Desert Housing Report (compiled by CDAR and PSRAR) is out, and I thought I’d share some of the highlights. In summary, sales slowed for the second month and more homes were on the market than the previous two months. While the change is not significant, it is starting to look like a trend, at least in the short term. This would be welcome news to buyers who have had a difficult time finding a home. If you’re thinking about selling your home, it may be time to give it serious consideration as inventory begins to increase. To read the full report, simply Click Here or click on the highlighted links below to see that individual chart. 

Coachella Valley Housing Inventory 

On September 1st total inventory in the Valley was 836 units, which compares to 1,959 units a year ago. This lack of inventory continues to be the overall driver of Valley housing and we are somewhat surprised inventory did not begin to increase after the wide distribution of the COVID vaccine. We had fully expected new listings to dramatically increase as homeowners felt safer to present their homes to strangers. We’re monitoring the situation for signs of its occurrence. 

Coachella Valley Median Detached Home Price 

In August, the median price of a detached home in the Coachella Valley was $581,500. This compares to $495,000 a year ago, which is an increase of 17.4%. We have entered the seasonal period when prices of detached homes generally begin to taper after the strong winter and spring period. Because of the price rise that began last July, year over-year price comparisons should also begin to moderate. We believe the major housing metrics are beginning to return to more normal numbers, but at a much higher price level. We see little price risk.

12 Month Change in City Median Prices 

Four cities have year-over-year price increases in detached homes over 30% – Indian Wells, Rancho Mirage, Desert Hot Springs and Indio. All cities except Rancho Mirage and La Quinta have exceeded the all-time high price made in 2006. Three cities have price increases over 30% for their attached homes – Indian Wells, La Quinta and Rancho Mirage. For the first time in a while, we’re seeing the largest price increases in higher priced homes. 

Detached, Attached and Total Sales - 3 Month Moving Average 

As the chart of three months sales clearly shows, sales have been slowing for the last three months. Some of this decline is seasonal in nature but some of it also represents a slow return to a more normal market. Total sales in August were only 3% above last August, which marked the start of last year’s sales surge. We believe it’s okay to see this as it’s hard to imagine sustaining those high numbers. 

Days in Market 

The median value of “days in the market” for the entire region continues to decline. It is now at 25 days compared to 56 days a year ago. This is another metric that we believe points to a housing environment with little price risk. Prices may stop moving much higher, but we don’t see them declining, at least not permanently. Prices may come back a little for seasonal reasons but should recover again at some point. 

Price Discount from List 

The median value for “Sale Price Discount from List” for detached homes in August was again 0.0%, which is the same discount it’s had for the last six months. As we’ve explained, since so many homes are selling right at list price, the median value is exactly 0.0%. When we calculate the average discount of detached homes, which averages the price discount of every sale, the average is a premium of 1.8%, which means the average home is selling for 1.8% above list price.

Average Price Discounts 

To get a little closer look at “Price Discounts” we’ve decided to add two charts that show the average value of this metric in each city for both detached and attached homes. We use average value instead a median value to overcome the limitation of using the median value when there is a large quantity of discounts at exactly the number. A plus percent means homes are selling above list price, a negative percent means below. Almost every city, except Indian Wells, is currently selling detached homes above list price.

Aug. 27, 2021

July 2021 Desert Housing Report

We saw some slight changes in the Coachella Valley real estate market in July. For the first time in many months, housing inventory increased slightly in July, and we saw less homes sold. This could be the start of a shift in the market, or it could be due to seasonal adjustments that we normally see this time of year. 

Below is a summary of the July 2021 monthly report compiled by the California Desert Association of Realtors (CDAR) and the Palm Springs Regional Association of Realtors (PSRAR). You can Click Here to read the full report or click on the highlighted links below to see that individual chart.

Coachella Valley Housing Inventory

On August 1st there were 791 Valley units for sale compared to 2,050 units last year. This lack of supply, plus surging sales, are the two forces that continue to push home prices higher. As the chart shows we’re starting the six-month seasonal period when inventory normally increases. Unless rising Covid infections again impedes the willingness of homeowners to list their homes, we expect this seasonal pattern of inventory rising to continue this year.

Median Detached Home Price

In July, the median price of a detached home in the Valley rose to $599,000, which is 30.2% higher than last June. The median price for attached homes in the Valley was $383,250, up 37.3% year over year. Year over year gains in city median prices for detached homes range from 42.5% for Indian Wells to 10.2% in the city of Coachella. Four cities have price gains for detached homes over 30% – Indian Wells, Rancho Mirage, Desert Hot Springs, and Indio. Four cities also have gains over 30% for attached homes – Indian Wells, La Quinta, Rancho Mirage and Palm Springs.

Total sales in July averaged 1,061 units a month, down from 1,200 units last month but still 40% above year ago levels. The largest sales increases continue to be in the cities of Palm Desert and La Quinta. The city of Rancho Mirage shows a large year over year percentage sales increase of 46%. The median value for “days in the market” in the Coachella Valley has dropped to just 25 days. This compares to 56 days one year ago. The “months of sales” ratio at the end of July was .7 months, up slightly from last month, which was an all-time low.

Median Attached Home Price

The median price for attached homes in July was $383,250, up almost 37.3% year over year. The chart clearly shows this price surge of the last twelve months. It also shows the distinct seasonal price pattern for Valley attached homes, which invariably reach peak price in July before giving back some of the gains over the next four or five months. Again, we expect a similar pattern this year, but because of the unique situation of extreme low supply and such heavy demand, the effect this year could be very muted.

12 Month Change in City Median Prices

Year over year gains in city median prices for detached homes range from 42.5% for Indian Wells to 10.2% in the city of Coachella. Four cities have gains over 30% for detached homes – Indian Wells, Rancho Mirage, Desert Hot Springs, and Indio. This is one city less than last month. Four cities now have gains over 30% for attached homes – Indian Wells, La Quinta, Rancho Mirage and Palm Springs.

Home Sales by City

The graph of sales by city clearly shows that the largest sales increases continue to be in the cities of Palm Desert and La Quinta. The city of Rancho Mirage also shows a large year over year percentage increase. As we move forward and the year ago numbers become the surge numbers of 2020, it will be important to see which cities can maintain the high sales numbers of last year.

Sale Price Discount from List

The median value for “Sale Price Discount from List” in July was again 0.0%, which is the same discount it’s had for the last five months. As we’ve explained, since so many homes are selling right at list price, the reason the median discount remains exactly 0.0% is because the median - or “middle value” - of this metric in the sample is exactly zero. When we calculate the average discount, which averages the price discounts of all the sales, the average discount is at a premium of 1.7%, which means the average home is selling for 1.7% above list price.

Now is a great time to sell your home! The low inventory and high prices will not last forever, and there is a sense of urgency to list and sell your home before inventory rises and prices stabilize. Please call, email or text me right now for a free valuation of your home, or you can Click Here to get an instant value of your home.  

June 8, 2021

Have We Reached the Peak in Home Prices?

Have we reached the peak in home prices in the desert? That is a question I am asked frequently and the answer seems to be not yet. The California Desert Association of Realtors (CDAR) and the Palm Springs Regional Association of Realtors (PSRAR) released their May 2021 Desert Housing Report. The report states that home prices continue to surge in the Valley with the median price of a detached home rising to $580,000, which is 32% higher than last year. 


Click Here to Read the Full Report


For the 11th straight month, the Valley’s median attached home price advanced. At the end of May it stood at $359,000 compared to $289,500 a year ago. This is an increase of 24%, which is slightly less than the increase for detached homes. At the city level median home prices continue to increase year-over-year in the nine major cities of the Valley. Gains range from 41.8% for Rancho Mirage to 8.1% in the city of Coachella. The three-month average of total sales, which shows both the seasonality and shorter-term sales trends, continues to hit all-time highs.


In May total sales hit an all-time high and were averaging almost 1,300 sales a month over the last three months. Two thirds of all sales were single-family residences and one third were attached homes. On June 1st there were 682 units for sale compared to 2,793 units on June 1st of last year. This lack of supply continues to draw home prices higher. Since sales remain high and inventory remains low at just under 700 units, the month of sales ratio is now at 6/10 of a month.


Coachella Valley Housing Inventory


Despite the growing number of new listings, inventory continues to remain low because high sales are rapidly absorbing these listings. On June 1st there were 682 units for sale compared to 2,793 units June 1st of last year. This lack of supply continues to draw home prices higher. As the chart clearly shows we are at the seasonal point where inventory normally declines but this seems almost impossible given the already low number. We continue to believe that new listings will move above normal levels, gradually increasing inventory over the next six months to a year.


Sale Price Discount from List


The median value for “Sale Price Discount from List” in May was 0.0%, which is the same discount it had the last three months. The reason the median price discount remains at exactly 0.0% is interesting. The median value is the middle number of all sales in the sample and in this current market more homes are selling at exactly list price than above or below it. This causes the median number to be exactly zero.


12 Month Change in City Median Prices


At the city level median home prices continue to increase year-over-year in the nine major cities of the Valley. Gains range from 41.8% for Rancho Mirage to 8.1% in the city of Coachella. Seven cities have gains for detached homes over 25%. Prices for detached homes in every city except Rancho Mirage and Coachella now exceed the historic highs made during the housing boom of 2004 to 2006. Gains in attached home prices range from 30.5% for La Quinta down to 10.9% for Indio.


Home Sales by City


Every city shows an increase in average sales compared to last year. The largest increases continue to be in the resort cities with milder increases in the residential areas. The chart clearly shows that the largest sales increases are in the cities of Palm Desert and La Quinta. Rancho Mirage has the largest percentage sales increase of 133%.


Home Sales by Price Range


When we measure sales in the different price brackets, we continue to find the largest sales increases in the middle to higher price brackets. Sales of homes under $300,000 continue to remain low there are fewer homes in these brackets due to the large price increases. Sales of million-dollar plus homes continue to amaze with sales averaging 200 units a month compared to just 54 units a year ago.


Now is a great time to sell your home. The low inventory and high prices will not last forever, and there is a sense of urgency to list and sell your home before inventory rises and prices begin to stabilize. Please call, email or text me right now for a free valuation of your home. Or, you can CLICK HERE to get an instant value of your home. 

Feb. 10, 2021

Desert Housing Reports

January 2021 Report - CLICK HERE to view the entire report. 

July 31, 2017

Curious About Local Real Estate?

Receive the Latest Local Market Stats

Curious about local real estate? So are we! Every month we review trends in our real estate market and consider the number of homes on the market in each price tier, the amount of time particular homes have been listed for sale, specific neighborhood trends, the median price and square footage of each home sold and so much more. We’d love to invite you to do the same!

Get Local Market Reports Sent Directly to You

You can sign up here to receive your own market report, delivered as often as you like! It contains current information on pending, active and just sold properties so you can see actual homes in your neighborhood. You can review your area on a larger scale, as well, by refining your search to include properties across the city or county. As you notice price and size trends, please contact us for clarification or to have any questions answered.

We can definitely fill you in on details that are not listed on the report and help you determine the best home for you. If you are wondering if now is the time to sell, please try out our INSTANT home value tool. You’ll get an estimate on the value of your property in today’s market. Either way, we hope to hear from you soon as you get to know our neighborhoods and local real estate market better.

Posted in Market Updates